Industrial inspection LiDAR becomes useful when it can support a repeatable decision—not merely produce an attractive depth image. For a fixture-clearance check, that means defining what is measured, testing the conditions that move the result, and deciding what happens when a reading sits too close to the limit.
Quick answer: do not wire a single threshold into the PLC after a clean bench demo. First create known-good and known-bad references, map invalid depth returns, test the relevant surfaces and angles, and reserve a review region between clear pass and clear reject results. If those populations overlap, change the geometry, sensing method, or process requirement before calling the station inspection-ready.
This is an engineering feasibility workflow. It is not accredited conformity assessment, calibration guidance, a safety-function design, or evidence that a compact module is metrology-grade.
Industrial inspection LiDAR should start with the decision, not the point cloud
“Check whether the part is seated” sounds precise until three teams interpret it differently. Quality may care about a drawing requirement. Automation may care about whether a tool can enter without collision. Operations may care about avoiding false rejects. Before choosing a sensor, give the station one measurable task.
For a loading fixture, a useful decision statistic could be the minimum measured clearance between a defined region on the part and a fixed clearance envelope in the fixture coordinate frame. That sentence establishes four things: the quantity, the region of interest, the reference frame, and the direction of conformance. A different task—presence, fill height, edge offset, or protrusion—needs its own definition.
Document who owns the physical requirement and who owns the decision rule. The controls engineer should not have to invent either while translating a depth frame into ladder logic. NIST’s paper on conformity decisions, guard bands, and risk makes a broader metrology point that applies here: uncertainty evaluation is technical, while the decision rule also reflects the consequences of accepting a bad part and rejecting a good one.
| Item to define | Fixture-clearance example | Owner |
|---|---|---|
| Physical requirement | The process-defined minimum clearance around the seated housing | Product and process engineering |
| Measured statistic | Minimum valid clearance inside a fixed region of interest | Inspection and perception engineering |
| Decision outputs | Pass, reject, or review | Quality, operations, and automation |
| Evidence retained | Raw frame, invalid-data mask, fixture transform, result, version, and timestamp | Controls and quality systems |
| Reverification trigger | Sensor remount, fixture repair, window replacement, software change, or new surface finish | Maintenance and quality |
What a pass/fail guard band changes
A drawing tolerance and a sensor acceptance limit are not automatically the same number. Readings near the physical limit are precisely where repeatability, alignment, surface response, and process variation can change the decision. A guard band deliberately separates the specification boundary from an automatic acceptance or rejection boundary.
For early feasibility work, use empirical language rather than claiming a formal uncertainty budget you have not established. Suppose the statistic d is minimum clearance and higher is better. Run production-representative known-good and known-bad references through every planned condition:
- B-high is the highest observed result among known-bad cases.
- G-low is the lowest observed result among known-good cases.
- The open interval between B-high and G-low is an empirical separation region, not a certified uncertainty statement.
If G-low is not greater than B-high, the observed classes overlap. No clever threshold repairs that evidence. Improve the viewpoint, fixture, region of interest, reference method, or sensing technology and test again. If a stable gap exists, the responsible teams can define clear pass and reject limits and route the middle region to review. For metrics where lower is better, reverse the inequalities.
| Observed result | Station output | Required action |
|---|---|---|
| Clearly beyond the validated good-side limit | Pass | Retain the compact evidence record and continue the cycle. |
| Inside the defined guard region | Review | Reacquire, inspect with a reference method, or divert without pretending certainty. |
| Clearly beyond the validated bad-side limit | Reject | Divert the part and retain enough data to diagnose the cause. |
| Too few valid measurements or broken geometry | Invalid | Treat as a sensing fault or review event, never as zero clearance or an automatic good reading. |
A six-step industrial inspection LiDAR feasibility workflow
1. Freeze the fixture frame and region of interest
Start with a drawing of the buildable station. Record the module location, nominal pose, fixture datums, part envelope, tool path, and every post or arch that can block the view. Define the region of interest in fixture coordinates so that a later camera crop or mount adjustment cannot silently change what the inspection means.
Calculate where the field of view lands at the near and far faces, but use that only as a mounting estimate. The final coverage proof must come from real depth data. Purpleriver’s compact dToF evaluation workflow is a useful bring-up companion when the module and host system are still on the bench.
2. Measure a reference artifact before measuring parts
Place a simple artifact in the actual fixture: for example, a matte stepped target with independently verified step locations. Capture it at the start of a trial, after warm-up, after any remount, and at the end. The artifact will not reproduce every production surface, but it helps separate gross alignment or range changes from part-to-part variation.
Record the artifact identity and its reference method. A ruler measurement typed into a spreadsheet without provenance is not traceability. NIST’s review of laser-scanner performance evaluation explains why application tolerances, error sources, specialized test procedures, measurement uncertainty, and traceability matter when instrument specifications are difficult to compare.
3. Build an invalid-data and occlusion mask
A 40 × 30 depth output contains 1,200 sample locations, but that does not mean every location supplies a valid measurement on every frame. First mark pixels that never see the required surface because of the fixture. Then track intermittent invalid returns separately from valid distances.
Do not average missing samples into the clearance statistic as zeros. Also do not fill a hole and then treat the filled value as measured evidence. The station should have a minimum valid-sample rule for each critical region. If that rule fails, the output is invalid or review—not pass.
4. Cross the material, angle, range, and orientation conditions
Production parts rarely present one cooperative matte face. A pump housing may combine dark paint, rough casting, a machined flange, curved edges, oil residue, and changing incidence angles. Build a compact matrix that includes the expected extremes rather than collecting hundreds of nearly identical frames.
NIST TN 1695 evaluated how range, incidence angle, reflectivity, azimuth, sampling method, and target geometry affect range error in a 3D imaging system. That study is not a performance prediction for this compact module. It is a strong reason to vary those factors in your own cell instead of extrapolating from a perpendicular white target.
| Factor | Minimum useful trial | Evidence to retain |
|---|---|---|
| Distance | Nearest, nominal, and farthest permitted part positions | Raw frames and reference-artifact readings |
| Incidence angle | Nominal pose plus worst allowed tilt or seating error | Fixture pose and valid-return map |
| Surface | Painted, cast, machined, and expected contaminated states | Part/finish ID and missing-data rate |
| Occlusion | Every allowed fixture and tool position | Occlusion mask and critical-region coverage |
| Time | Cold start, warmed operation, and end of representative run | Timestamps, temperature context, and artifact checks |
5. Run known-good and known-bad references through the complete matrix
Known-good should mean the part was independently shown to meet the physical requirement—not merely that the LiDAR reported a large clearance. Known-bad should be created with controlled shims, offsets, or reference pieces and confirmed by the reference method. Random production rejects are useful later, but they often contain several uncontrolled defects at once.
Repeat each important state enough to expose restart, remount, lot, and surface variation relevant to your line. There is no universal sample count that turns a feasibility test into validation. Predefine the conditions, number of cycles, exclusion rules, and failure criteria with the people who own process risk.
6. Freeze the evidence pack and reverification triggers
A deployable decision needs more than a CSV of final distances. Keep the fixture drawing, sensor pose, reference-artifact identity and result, region-of-interest definition, raw depth frame or point cloud, invalid-data mask, decision statistic, pass/reject/review output, configuration checksum, software version, and acquisition time.
Then define what invalidates the evidence: a sensor or bracket remount, fixture repair, cover-window replacement, firmware or filtering change, a new part finish, or a process range that exceeds the original matrix. Reverification can be smaller than initial validation when the change is bounded, but it should be planned before the first production alert.
MRP-LD1 parameters to test against the inspection task
Purpleriver’s current Featured product is the LiDAR Drone Module – MRP-LD1 Solid-State dToF Sensor. Its exported specifications make it a candidate for an industrial inspection LiDAR feasibility study; they do not establish whether it can meet a particular fixture tolerance.
| Published parameter | Exported value | Question for this cell |
|---|---|---|
| Ranging architecture | SPAD dToF with 940 nm VCSEL | Which target finishes and angles produce stable valid returns in the actual fixture? |
| Laser classification | Class 1 | What installation, enclosure, and application documentation does the complete machine require? |
| Indoor range | 0.5–25 m | Does the entire region of interest remain inside the tested working geometry? |
| Outdoor range | 0.2–8 m | If sunlight can reach the station, what does the real mixed-light trial show? |
| Published accuracy bands | 0.2–1 m: ≤ ±3 cm; 1–5 m: ≤ ±5 cm; 5–8 m: ≤ ±10 cm; 8–15 m: ≤ ±20 cm | Is the required class separation comfortably larger than observed system variation in this task? |
| Field of view | 60° horizontal × 45° vertical | Which fixture members occlude critical pixels at the buildable mounting pose? |
| Output grid and rate | 40 × 30 at 10 fps | Does the smallest critical feature occupy enough valid samples for a stable statistic within the cycle? |
| Interfaces | UART, UVC, UDP | Which interface preserves the evidence required during evaluation and deployment? |
| Supply and power | 5 V; 1.2 W | How will the production harness handle supply quality, grounding, routing, and service access? |
| Mass | 8 g | Can the small mount still be rigid, datum-controlled, and resistant to accidental movement? |
| Operating temperature | -20 to 60 °C | What narrower temperature range will the cell validate and monitor? |
| Storage temperature | -30 to 70 °C | Do storage and commissioning procedures keep the module within the published range? |
| Platform support | Windows, ARM, Linux, Android | Which host will capture raw evidence, and which host will run the deployed decision? |
Notice what the table does not promise. A published accuracy band is not a guaranteed class-separation margin for a curved, partly reflective housing behind a fixture arch. A field of view is not proof of unoccluded coverage. An interface name is not a ready-made PLC function block. Those are application questions.
Hypothetical case: pump-housing clearance in a loading fixture
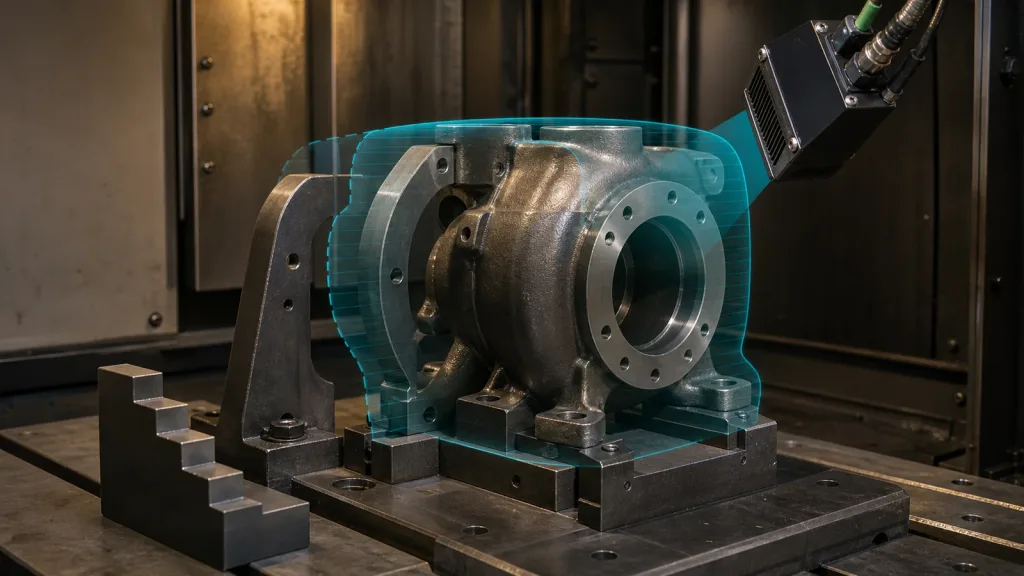
Consider a machine builder evaluating a fixed MRP-LD1 above a fixture that receives a pump housing. The process owner defines a required clearance envelope so a downstream tool can enter. The housing has painted, cast, and machined surfaces, while a fixture arch blocks part of the sensor view.
The team creates a matte stepped artifact that locates against the fixture datums. It then defines one region around the tool path and one statistic: minimum valid clearance to the envelope. Controlled shims create independently verified good and bad seating states. Each state is tested at allowed orientations, on representative finishes, and before and after a remount.
If the worst observed good result stays distinctly above the best observed bad result, the team has evidence for a review region and can begin a risk-based decision-rule discussion. If the observations overlap, the correct outcome is not a more persuasive dashboard. The team must move the module, change the region, expose a better surface, tighten the fixture, add another viewpoint, or choose another measurement method.
This scenario is a planning example, not a reported customer result or product-performance claim. It shows how a physical task can be converted into evidence without inventing a successful benchmark.
Data and interface evidence: preserve enough to replay the decision
During evaluation, choose the MRP-LD1 interface that makes raw capture and replay practical. UART, UVC, and UDP are exported product options, but the best path depends on host hardware, latency, cable design, logging volume, and the deployed control architecture. The guide to choosing a LiDAR interface explains those tradeoffs, while visualizing dToF depth data helps teams inspect early frames. Purpleriver’s sample-dataset resources can also help you design the replay workflow before production data accumulates.
A point-cloud or depth-frame record should identify when the data was acquired, which coordinate frame it uses, how fields are laid out, and whether invalid points are present. The official ROS 2 PointCloud2 message definition is a useful public example of those metadata concepts. It does not imply that the MRP-LD1 provides a native ROS driver.
| Record | Why it matters after a disputed reject |
|---|---|
| Acquisition time and cycle ID | Connects the depth evidence to the correct part and machine state. |
| Fixture frame and transform version | Shows where the clearance region existed when the decision was made. |
| Raw or minimally processed depth | Allows later filters to be tested without losing the original observation. |
| Invalid-data mask | Prevents a hole-filling step from becoming invisible evidence. |
| Decision statistic and limits | Explains why the station returned pass, reject, review, or invalid. |
| Software and configuration identity | Supports comparison before and after a change. |
Common mistakes that make a threshold look stronger than it is
- Using the drawing limit as the PLC threshold. This ignores measurement behavior near the boundary and hides who accepted the decision risk.
- Testing only nominal good parts. Without controlled bad references, class separation is unknown.
- Converting invalid depth to zero. Missing evidence then looks like a physical surface.
- Averaging across an occlusion boundary. A smooth number can conceal that the feature is only partly visible.
- Changing filters after validation. A new filter changes the measurement process and may move the decision statistic.
- Logging only the final pass bit. Borderline and disputed events cannot be replayed.
- Calling repeatability “accuracy.” A stable bias can still produce consistently wrong clearance values.
- Treating the sensor as a safety device. No safety rating or protective-function claim is established by the product facts used here.
RFQ and sample-evaluation checklist
Send the application geometry with the sample request. A useful RFQ is specific enough that the supplier can identify a mismatch early and the evaluation team can reproduce the same task.
| Include | Question it answers |
|---|---|
| Near/far working distance and buildable mount pose | Can the required region fit the usable geometry? |
| Smallest feature and physical tolerance | Is the decision plausible at the available spatial sampling and observed variation? |
| Surface and contamination list | Which samples and angle conditions belong in the trial? |
| Fixture model or annotated photographs | Where will occlusion and unwanted returns occur? |
| Required cycle time and acquisition phase | How many frames can be captured while the part is stationary? |
| Preferred evaluation and deployment interfaces | Which UART, UVC, or UDP path should be brought up first? |
| Raw-data and invalid-value requirements | Can the evidence be retained without destructive preprocessing? |
| Decision costs and review path | Who owns false-accept, false-reject, and borderline outcomes? |
| Change-control and reverification plan | Which mechanical, optical, or software changes trigger new evidence? |
For supplier-side evidence beyond the application test, see Purpleriver’s quality-inspection notes for solid-state LiDAR modules. That manufacturing evidence complements the cell study; it does not replace it.
Turn your fixture drawing into a useful sample test
If you can share the working distance, mount constraints, critical surfaces, smallest required clearance, preferred interface, and cycle timing, Purpleriver can help you screen whether the featured compact dToF module belongs in the evaluation.
Contact Purpleriver with the inspection geometry. Bring a reference method and known-good/known-bad parts to the test; the goal is a decision you can defend, not merely a colorful point cloud.